Restaurant Consumer Data: my first data storytelling project
Exploring how payment options and customer personality relate to restaurant ratings, from my first weeks at BloomTech (Lambda School).
2026 note: This is one of the first things I ever published about data, written in my first weeks at BloomTech (then Lambda School). I’ve kept it mostly as written, with typos fixed, as a marker of where I started.
My project revolves around the data gathered from 130 restaurants and subsequently the rating those received from 138 users. This dataset has a lot of information we can use as parameters to make predictions on the rating they might receive from each user.
For my first storytelling project I will test the number of accepted methods of payment versus the average rating they received. I will also test the personality trait for each user versus the average rating they gave.
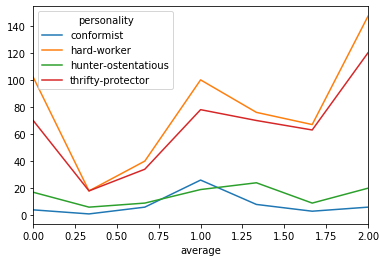
The following graph reveals a story amongst the users when we grouped them by personality [personality, conformist, hard-worker, hunter-ostentatious, thrifty-protector]. This graph shows us that a majority of the people rating these restaurant identified as hard-workers and thrifty-protector. With a closer look at the graph it also shows us a clear difference in the average ratings that the different personalities gave each restaurant. In a future project I would like to take a closer look at how the personality each person chose affects more specific traits-like the preferred dress code of the restaurant- in their voting methodology.
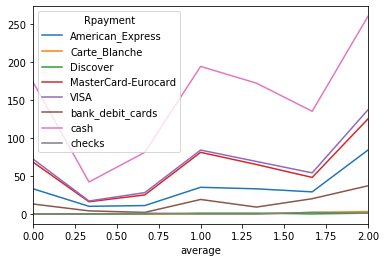
The following graph separates the restaurants by their accepted payment methods and shows us how this might have affected their overall ratings. Looking at the graph we can see that these restaurants accept cash the most as a form of payment. Followed by Visa and Mastercard-Eurocard. American Express is in the middle. With Discover, Checks, and carte_Blanche at the very bottom.
As far as ratings we cannot make any further conclusions from looking at the graph to say that accepted methods of payment affect ratings since the lines for all the methods of payment have very similar changes throughout the ratings.
Thank you for reading this! I hope to make a more in-depth analysis on this data set as I have worked in restaurants and sales for most of my adult career(a short 6 years) and my interest in Business Administration aligns very well with being able to discern noise from useful information like this.
For more information about this dataset please visit https://archive.ics.uci.edu/ml/datasets/Restaurant+%26+consumer+data.